




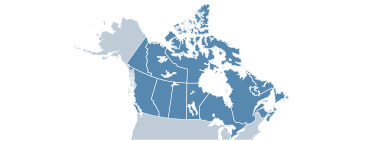
AO offered students career pathways culminating in one or more credentials in high-demand fields, including health care and manufacturing. Instructional courses were delivered at local colleges using team teaching of basic skills, CTE, and basic skills instruction delivered using meaningful content. AO also provided academic services, such as tutoring and academic advising, and supportive services, such as transportation and child care assistance, to students. The pathways consisted of about 12 academic credits. Most of the pathways lasted one academic year or less. The program was offered to English-speaking students enrolled in adult, developmental, or CTE education programs who had scored at the 6th- to 12th-grade level on a math, reading, or writing test. AO was implemented at several colleges across seven states (Arkansas, Georgia, Illinois, Kansas, Kentucky, Louisiana, and Mississippi) but was only evaluated in four states (Illinois, Kansas, Kentucky, and Louisiana).
Summary
Accelerating Opportunity (AO) offered career and technical education (CTE) courses to students with low income in order to provide credentials designed to enhance their educational and employment outcomes.
Effectiveness rating and effect by outcome domain
View table definitionsScroll to the right to view the rest of the table columns
| Outcome domain | Term | Effectiveness rating | Effect in 2024 dollars and percentages | Effect in standard deviations | Sample size |
|---|---|---|---|---|---|
| Increase earnings | Short-term | 
|
 $1,021 per year |
0.028 | 42647 |
| Long-term |
|
$2,770 per year
|
0.076 | 42647 | |
| Very long-term |  |
||||
| Increase employment | Short-term | 
|
7% (in percentage points)
|
0.182 | 3455 |
| Long-term | 
|
 -1% (in percentage points) |
-0.021 | 3455 | |
| Very long-term | |
||||
| Decrease benefit receipt | Short-term | |
|||
| Long-term | |
||||
| Very long-term | |
||||
| Increase education and training | All measurement periods | 
|
22% (in percentage points)
|
0.441 | 42647 |
Studies of this program
| Study quality rating | Study counts per rating |
|---|---|
 Moderate |
4 |
Program cost
No cost information available.
Cost results
| Estimates (in 2024 dollars) | Quality of cost analyses that produced the estimates | |
|---|---|---|
| Total program cost, per participant | $3,399–$9,194 |
Good quality
|
| Net benefit to participants, per participant | -$393–$5,199 |
Good quality
|
Cost information
How much did the program cost per participant?
The average total program cost per participant ranged from $3,399 to $9,194 in 2024 dollars. This figure is based on cost information reported in four cost studies reviewed by Pathways to Work (for details, see the FAQ). The AO studies were conducted in four states implementing the program: Louisiana ($3,399 per participant), Kansas ($3,505 per participant), Kentucky ($5,840 per participant), and Illinois ($9,194 per participant). These studies all received a rating of Good quality for the cost analyses.
How much did the program cost relative to the benefits it generated?
A cost-benefit analysis was conducted in the cost studies reviewed, with all studies receiving a rating of Good quality. The net benefit to participants ranged from -$393 per participant to $5,199 per participant in 2024 dollars as follows: Kentucky (-$393 per participant), Illinois ($909 per participant), Louisiana ($2,114 per participant), and Kansas ($5,199 per participant). This means that the net program benefit to participants (difference in benefits between the program and comparison group) ranged from $393 less than the net cost of the program to participants in Kentucky to $5,199 more than the net cost of the program to participants in Kansas. The estimate is expressed as the net present value, which accounts for differences in the timing of when benefits and costs occurred. In addition, the net benefit to society ranged from -$9,306 per participant to $2,057 per participant in 2024 dollars as follows: Illinois (-$9,306 per participant), Kentucky (-$5,059 per participant), Louisiana (-$1,322 per participant), and Kansas ($2,057 per participant).
Cost information is not directly comparable across programs due to differences in the categories of costs reported and program length. Cost information is not an official price tag or guarantee.
Implementation details
Dates covered by study
The study ran from January 2012 to March 2016. Study enrollment ran from January 2012 to December 2014. Data collection occurred from January 2012 to March 2016, with outcomes measured with administrative data over a three-year follow-up period.
Organizations implementing program
Jobs for the Future implemented the AO initiative with the National Council for Workforce Education, the National College Transition Network, and the State Board for Community and Technical Colleges in Washington State. Educational services were provided at local colleges.
Populations served
The study sample was composed of English-speaking students with low income who were in adult education programs or being served by community-based organizations and had scored at the 6th- to 12th-grade level on a math, reading, or writing test. The majority of participants had at least a high school diploma (78 percent); were White, not Hispanic (64 percent); and were female (57 percent).
Description of services implemented
The AO initiative aimed to improve academic outcomes and labor market success for students with low income who were in adult education programs or in need of basic education or English language learners.
- Career pathways. An initial phase consisted of completing 12 academic credits within one academic year or less. Colleges had to offer at least two pathways that began with adult basic education or English as a second language classes and led to the completion of a college-level certificate. The pathways were designed to be manageable for individuals with low skills and with other family and work commitments. Subsequent pathways steps allowed for earning additional credentials and degrees to qualify for mid- to high-skilled occupations.
- Integrated Instruction. Both basic skills and CTE instructors taught in the same classroom with at least 25 percent of instruction delivered using a team teaching approach.
- Acceleration strategies. Colleges had to offer acceleration strategies, including contextualized learning and the use of hybrid (online- and classroom-based) course designs.
- Employer partnerships. Colleges had to demonstrate or create partnerships with local employers and workforce investment boards.
- Support services. AO offered comprehensive student supports and navigation services. Services included tutoring, child care, transportation, subsidized jobs, and help accessing public benefits.
Service intensity
The initial phase of the AO career pathway consisted of approximately 12 academic credits and lasted one academic year or less.
Comparison conditions
Students enrolled in adult education, developmental education, or CTE courses comprised the comparison group. Comparison group members were enrolled in a for-credit course at a college with an AO initiative program but were not enrolled in the AO program during the study period.
Partnerships
Colleges participating in AO formed external partnerships to facilitate labor market connections for participants and access to support services and formed internal partnerships within the college to facilitate program delivery and transitions to employment.
- Employers and workforce investment boards. Colleges were required to demonstrate evidence of partnerships with employers. Some colleges engaged employers with the design of the career pathways.
- Community-based organizations. Colleges partnered with community-based organizations to provide support services and individualized case management. These organizations were also an important source of program referrals.
- Internal partnerships. Colleges formed partnerships among adult education, CTE departments, admissions departments, financial aid, and student support services providers within the college. These partnerships aimed to facilitate co-enrollment in both adult education and college courses, increase available resources, and facilitate transitions to employment.
Staffing
AO was primarily delivered by adult education staff at participating colleges and college teachers.
Fidelity measures
The study did not discuss any tools to measure fidelity to the program model.
Funding source
This program was funded through grants to states provided by the Bill & Melinda Gates Foundation, the Joyce Foundation, the W. K. Kellogg Foundation, the Kresge Foundation, the Open Society Foundations, the Arthur Blank Foundation, the Woodruff Foundation, the Annie E. Casey Foundation, and the University of Phoenix Foundation.
State(s) where implemented
Pathways to Work refers to programs by the names used in study reports or manuscripts. Some program names may use language that is not consistent with our style guide, preferences, or the terminology we use to describe populations.